![]()
![]()

![]()
![]()

Getting Started on the UL HPC platform
Copyright (c) 2013-2021 UL HPC Team <hpc-sysadmins@uni.lu>

This tutorial will guide you through your first steps on the UL HPC platform.
Before proceeding:
- make sure you have an account (if not, follow this procedure), and an SSH client.
- take a look at the Getting Started
- Follow the "Linux Shell" Tutorial
From a general perspective, the Support page describes how to get help during your UL HPC usage.
Convention
In the below tutorial, you'll proposed terminal commands where the prompt is denoted by $>.
In general, we will prefix to precise the execution context (i.e. your laptop, a cluster access server or a node). Remember that # character is a comment. Example:
    # This is a comment
    $> hostname

    (laptop)$> hostname         # executed from your personal laptop / workstation

    (access-iris)$> hostname    # executed from access server of the Iris cluster
Platform overview.
You can find a brief overview of the platform with key characterization numbers on this page.
The general organization of each cluster is depicted below:

Details on this organization can be found here
Discovering, visualizing and reserving UL HPC resources
In the following sections, replace <login> in the proposed commands with you login on the platform (ex: svarrette).
Step 1: the working environment
- reference documentation
After a successful login onto one of the access node (see Cluster Access), you end into your personal homedir
$HOMEwhich is shared over GPFS between the access node and the computing nodes.
Otherwise, you have to be aware of at least two directories:
$HOME: your home directory under NFS.$SCRATCH: a non-backed up area put if possible under Lustre for fast I/O operations
Your homedir is under a regular backup policy. Therefore you are asked to pay attention to your disk usage and the number of files you store there.
-
Estimate file space usage and summarize disk usage of each FILE, recursively for directories using the
ncducommand:(access)$> ncdu -
You can get an overview of the quotas and your current disk usage with the following command:
(access)$> df-ulhpc -
You shall also pay attention to the number of files in your home directory. You can count them as follows:
(access)$> df-ulhpc -i
Step 2: web monitoring interfaces
Each cluster offers a set of web services to monitor the platform usage:
Ganglia
Ganglia is a scalable distributed monitoring system for high-performance computing systems such as clusters and Grids. Ganglia provides plots the system usage for each individual compute nodes (CPU, memory, I/O and network usage).
These information will help you identify and understand the behavior of your jobs on the cluster.
It is interesting to identify the limiting factor of your job:
- Memory
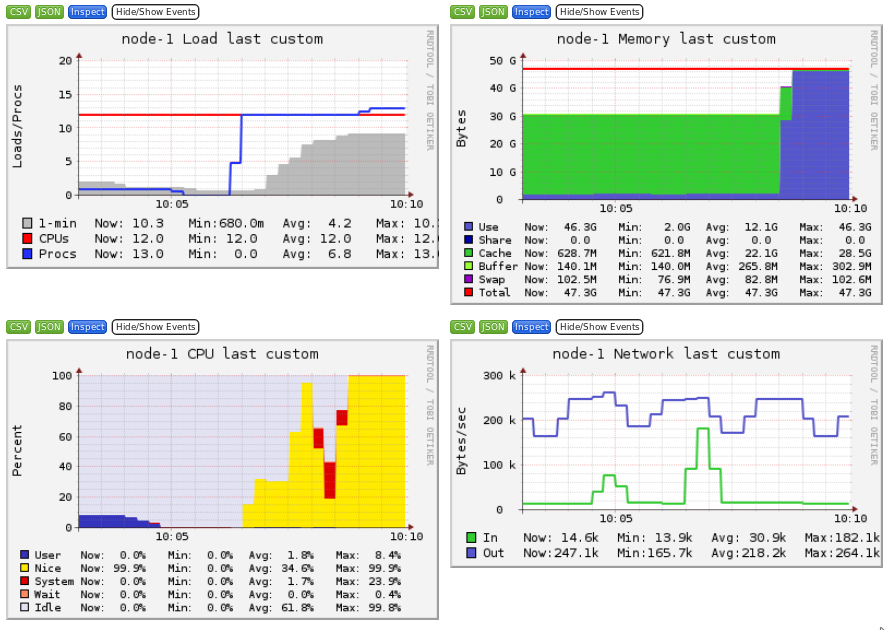
- CPU
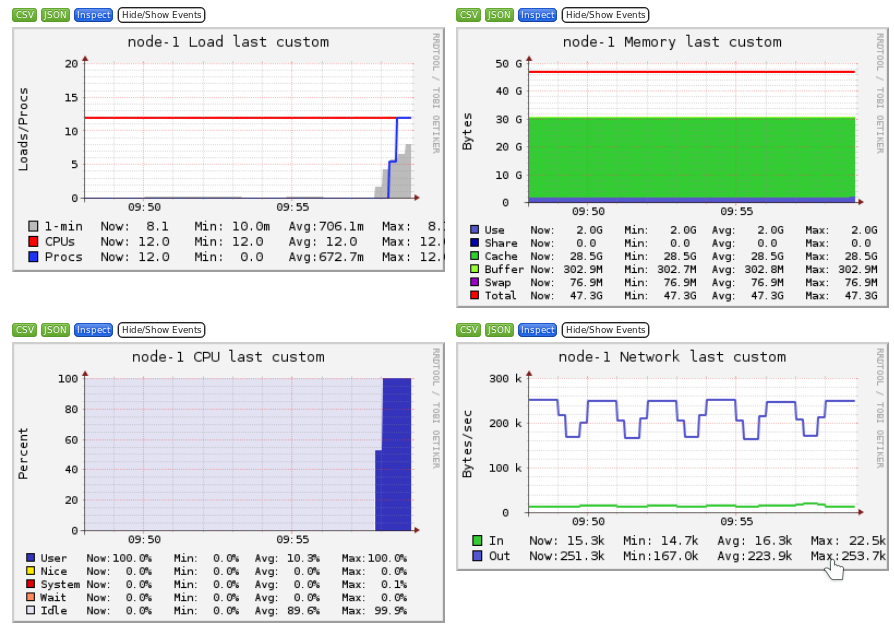
- Storage I/O
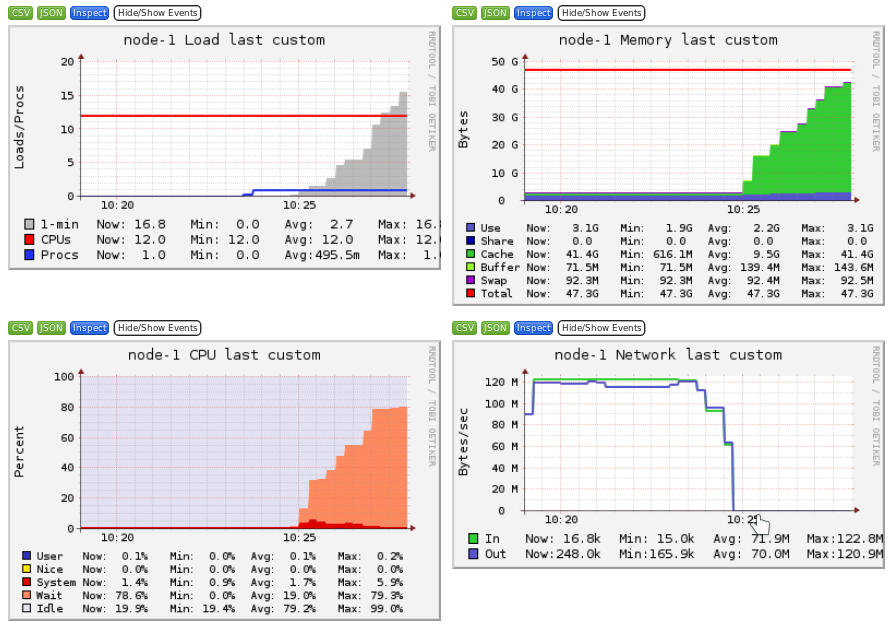
- Network bound
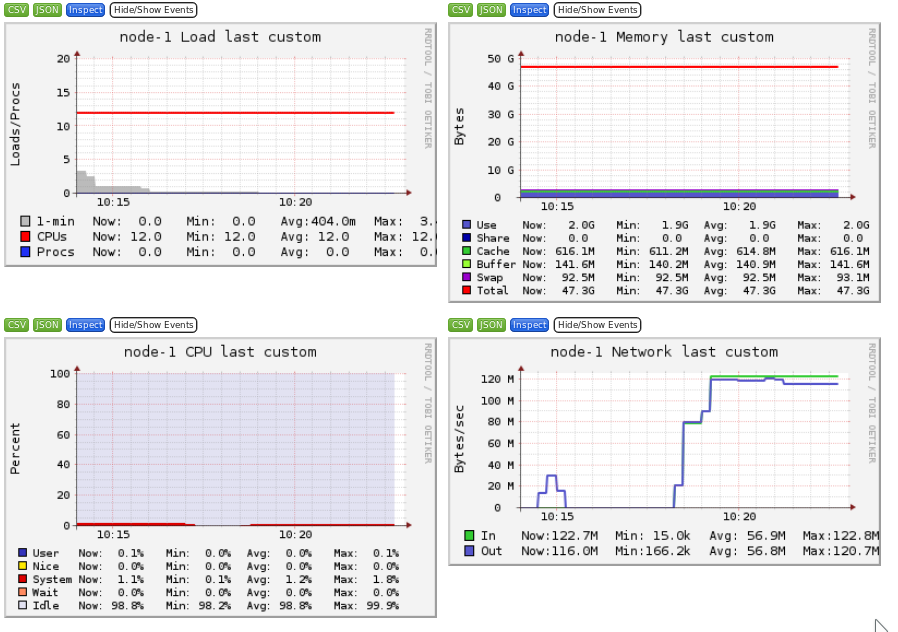
This is covered in the other tutorial Monitoring and profiling
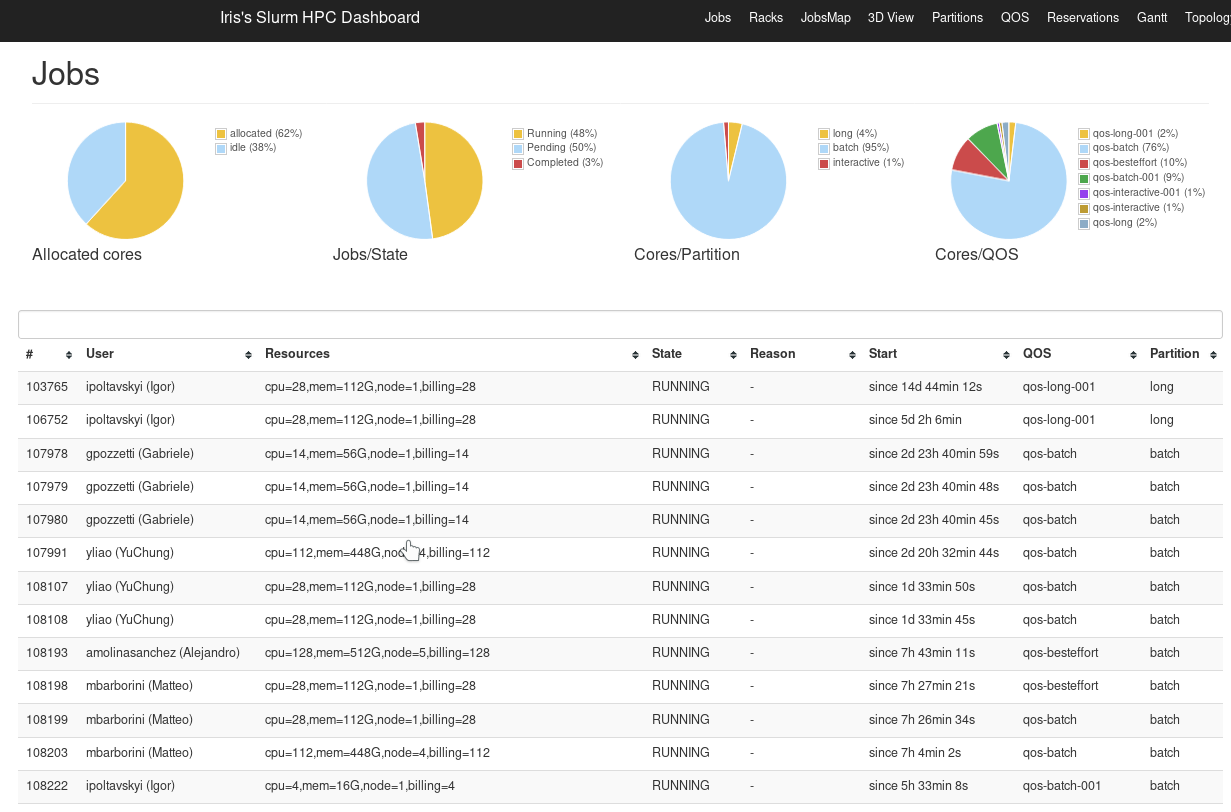
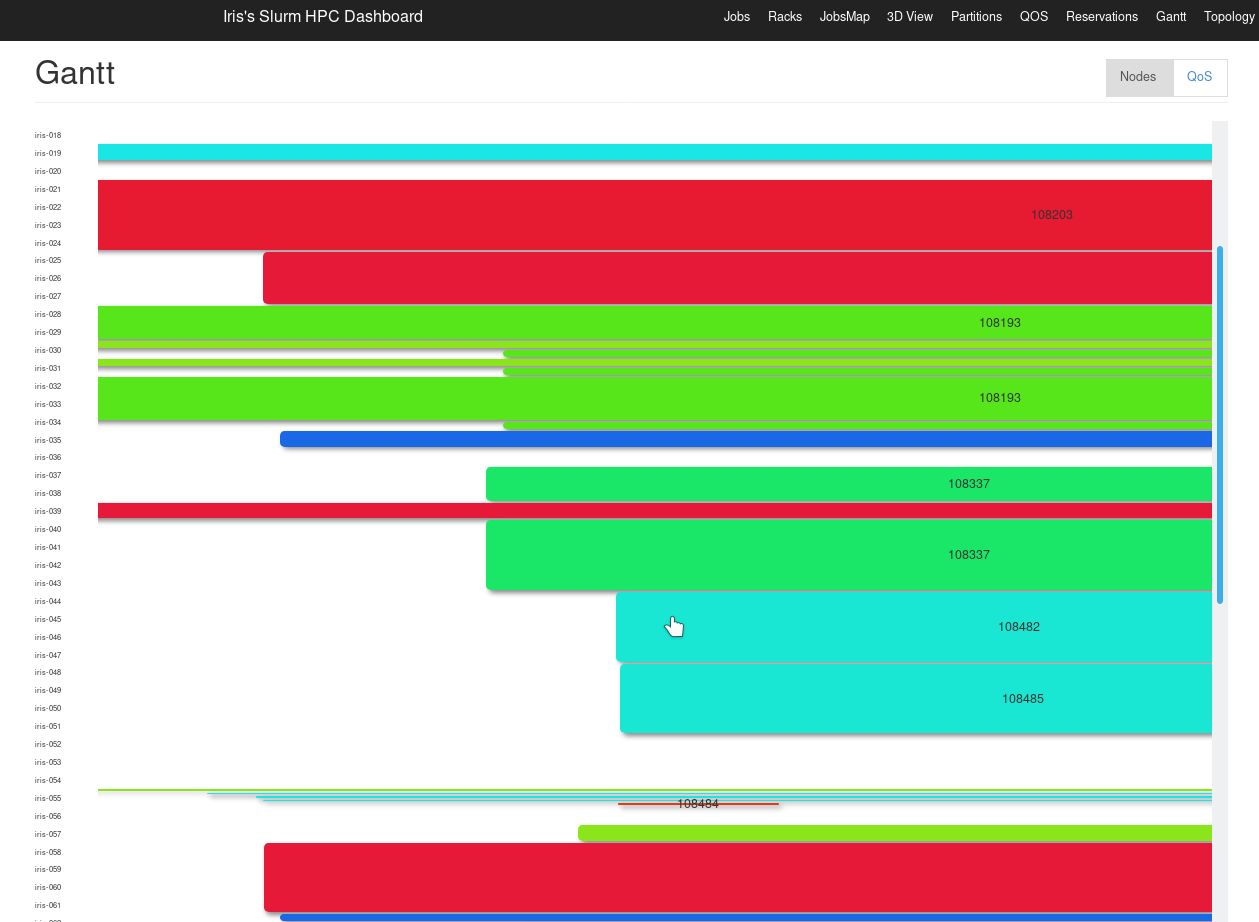
SLURM Web
SLURM Web is a website that show the status of jobs and nodes with a nice graphical interface.
You can use the SLURM web interface for a visualization of the job scheduler state (list and gantt chart visualization).
Sample Usage on the UL HPC platform: Kernel compilation
We will illustrate the usage of tmux by performing a compilation of a recent linux kernel.
-
start a new tmux session
(access)$> tmux -
rename the screen window "Frontend" (using
CTRL+b ,) -
create a new window and rename it "Compile"
-
within this new window, start a new interactive job over 1 node and 2 cores for 2 hours
(access)$> si --time 2:00:0 -N 1 -c 2 -
detach from this screen (using
CTRL+b d) - kill your current SSH connection and your terminal
- re-open your terminal and connect back to the cluster access server
-
list your running tmux sessions:
(access)$> tmux ls 0: 1 windows (created Mon Nov 15 17:48:58 2021) [316x46] -
re-attach your previous screen session
(access)$> tmux a # OR tmux attach-session -t 0: -
in the "Compile" windows, go to the temporary directory and download the Linux kernel sources
(node)$> cd /tmp/
(node)$> curl -O https://cdn.kernel.org/pub/linux/kernel/v4.x/linux-4.19.163.tar.xz
IMPORTANT to avoid overloading the shared file system with the many small files involves in the kernel compilation (i.e. NFS and/or Lustre), we will perform the compilation in the local file system, i.e. either in /tmp or (probably more efficient) in /dev/shm (i.e in the RAM):
    (node)$> mkdir /dev/shm/PS1
    (node)$> cd /dev/shm/PS1
    (node)$> tar xf /tmp/linux-4.19.163.tar.xz
    (node)$> cd linux-4.19.163
    (node)$> make mrproper
    (node)$> make alldefconfig
    (node)$> make 2>&1 | tee /dev/shm/PS1/kernel_compile.log
- You can now detach from the tmux session and have a coffee
The last compilation command make use of tee, a nice tool which read from standard input and write to standard output and files. This permits to save in a log file the message written in the standard output.
Question: why using the make 2>&1 sequence in the last command?
Question: why working in /dev/shm is more efficient?
- Reattach from time to time to your tmux session to see the status of the compilation
-
Your compilation is successful if it ends with the sequence:
[...] Kernel: arch/x86/boot/bzImage is ready (#2) -
Restart the compilation, this time using multiple cores and parallel jobs within the Makefile invocation (
-joption of make)(node)$> make clean (node)$> time make -j $SLURM_CPUS_ON_NODE 2>&1 | tee /dev/shm/PS1/kernel_compile.2.log
The table below should convince you to always run make with the -j option whenever you can...
| Context | time (make) |
time (make -j 16) |
|---|---|---|
Compilation in /tmp(HDD / chaos) |
4m6.656s | 0m22.981s |
Compilation in /tmp(SSD / gaia) |
3m52.895s | 0m17.508s |
Compilation in /dev/shm (RAM) |
3m11.649s | 0m17.990s |
- Use the Ganglia interface to monitor the impact of the compilation process on the node your job is running on.
-
Connect to your interactive job using the command
sjoin <jobid>. Use the following system commands on the node during the compilation:htoptopfree -muptimeps aux